
Definition and Meaning
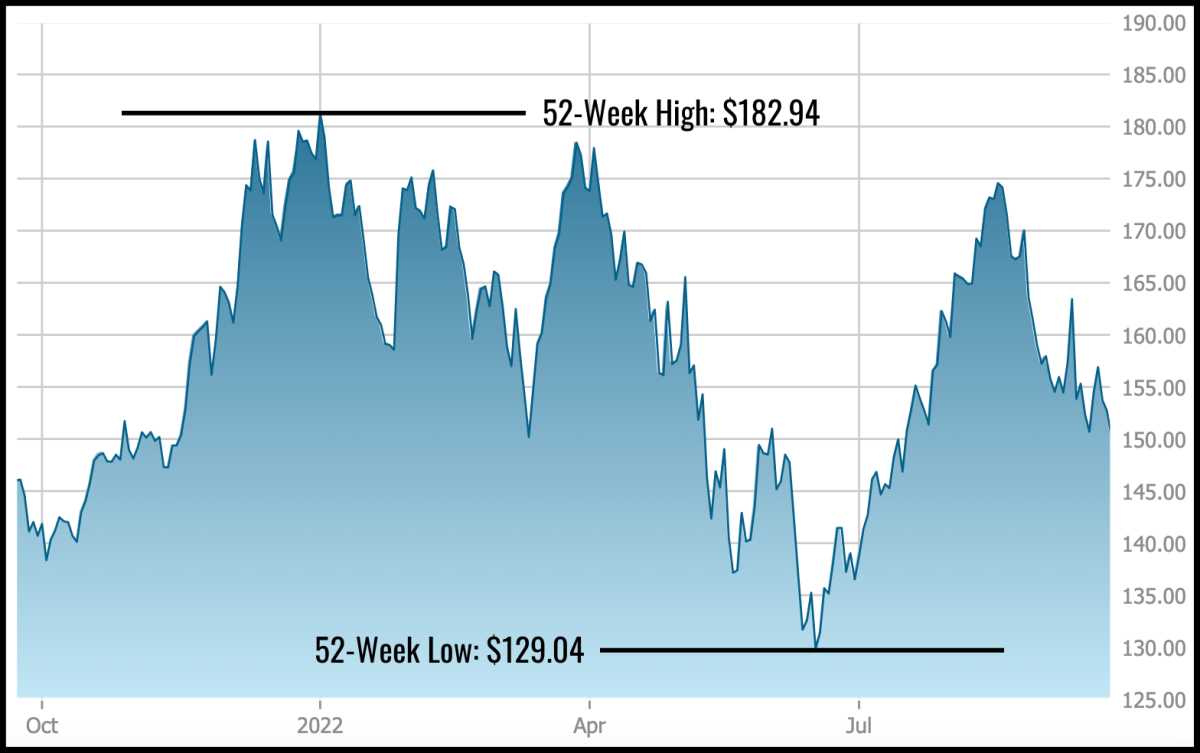
The 52-week high/low is a term used in the financial market to refer to the highest and lowest prices that a particular stock or security has reached over the past 52 weeks. It is an important indicator that provides insights into the performance and volatility of a stock.
The 52-week high represents the highest price at which a stock has traded during the past year, while the 52-week low represents the lowest price at which it has traded. These prices are often considered significant because they reflect the upper and lower boundaries of a stock’s price range over a specific period of time.
Investors and traders use the 52-week high/low as a reference point to evaluate the current price of a stock. If the current price is close to the 52-week high, it may indicate that the stock is performing well and has potential for further growth. On the other hand, if the current price is close to the 52-week low, it may suggest that the stock is undervalued and could be a good buying opportunity.
The 52-week high/low is also used to identify trends and patterns in stock prices. For example, if a stock consistently reaches new 52-week highs, it may indicate a bullish trend and attract more investors. Conversely, if a stock consistently reaches new 52-week lows, it may indicate a bearish trend and discourage investors.
Overall, the 52-week high/low is a valuable tool for investors and traders to assess the performance and potential of a stock. It provides a historical context and helps in making informed decisions based on the past price movements of a stock.
Importance in Trading
The 52-week high/low is an important concept in trading as it provides valuable information to traders and investors. It serves as a key indicator of a stock’s performance and can help determine its future direction.
On the other hand, when a stock hits its 52-week low, it indicates a negative sentiment and selling pressure. This could be due to various factors such as poor company performance, negative news, or overall market conditions. Traders may see this as an opportunity to short sell the stock or wait for a potential rebound.
Furthermore, the 52-week high/low can provide insights into a stock’s volatility. If a stock frequently reaches new highs or lows, it suggests a higher level of volatility, which can present both opportunities and risks for traders.
Overall, the 52-week high/low is an essential tool for traders and investors to assess the strength and direction of a stock. It helps identify potential buying or selling opportunities, determine support and resistance levels, and gauge a stock’s volatility. By incorporating this information into their trading strategies, traders can make more informed decisions and increase their chances of success.
Role of 52-Week High/Low in Technical Analysis
1. Identifying Support and Resistance Levels
The 52-week high/low is often used to identify key support and resistance levels. The 52-week high represents a strong resistance level, indicating that the stock has struggled to surpass this price in the past year. On the other hand, the 52-week low represents a significant support level, suggesting that the stock has found buying interest at this price point.
By analyzing the price action around these levels, traders can determine the strength of the trend and potential reversal points. If a stock breaks above its 52-week high, it may indicate a bullish signal, suggesting that the stock could continue to rise. Conversely, if a stock falls below its 52-week low, it may indicate a bearish signal, suggesting that the stock could continue to decline.
2. Assessing Market Sentiment
The 52-week high/low can also provide insights into market sentiment. If a stock is trading near its 52-week high, it may indicate that investors have a positive outlook on the company’s prospects. This can be a sign of bullish sentiment and may attract more buyers to the stock.
Conversely, if a stock is trading near its 52-week low, it may indicate that investors have a negative perception of the company’s performance. This can be a sign of bearish sentiment and may discourage potential buyers from entering the market.
3. Setting Price Targets
The 52-week high/low can be used to set price targets for a stock or security. Traders often look at the previous 52-week high as a potential target for a bullish trade. If a stock breaks above its 52-week high, it may indicate a strong upward momentum and potential for further gains.
Similarly, traders may look at the previous 52-week low as a potential target for a bearish trade. If a stock falls below its 52-week low, it may indicate a strong downward momentum and potential for further losses.
4. Confirmation of Breakouts
The 52-week high/low can also be used to confirm breakouts. A breakout occurs when a stock moves above its 52-week high or below its 52-week low with significant volume and price momentum. This can be a strong indication that the stock is undergoing a significant trend reversal.
By waiting for confirmation from the 52-week high/low, traders can reduce the risk of false breakouts and increase the probability of successful trades.
Real-Life Example
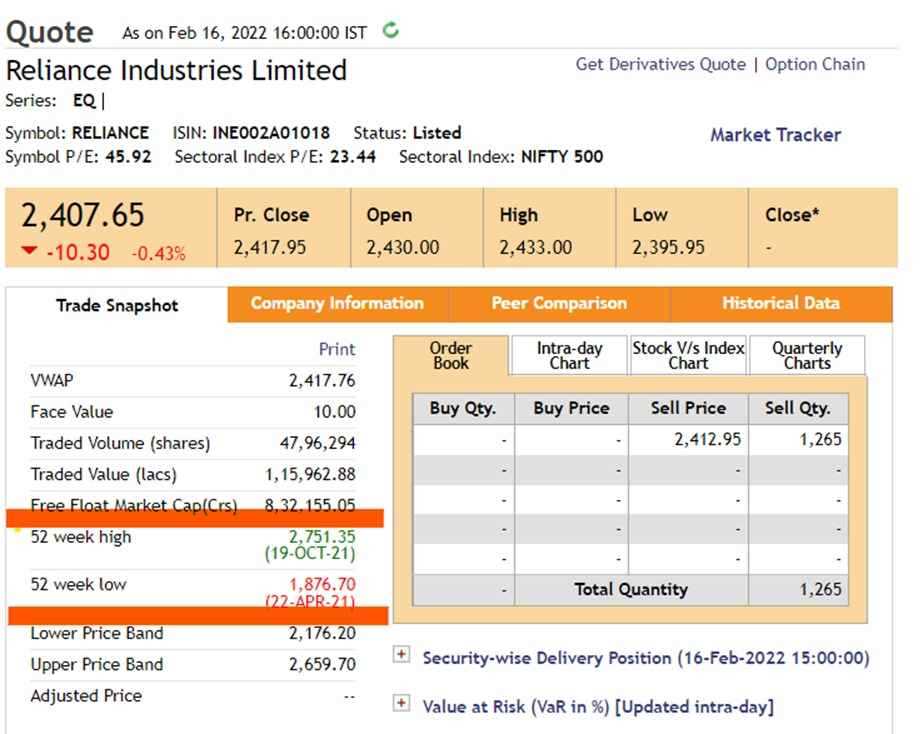
Suppose you are considering investing in a particular stock. By looking at its 52-week high/low, you can gain valuable insights into the stock’s performance over the past year. If the stock is currently trading near its 52-week high, it indicates that the stock has been performing well and has potential for further growth. On the other hand, if the stock is trading near its 52-week low, it suggests that the stock has been underperforming and may not be a good investment option.
For instance, let’s say Company XYZ has a 52-week high of $100 and a 52-week low of $50. Currently, the stock is trading at $90. Based on this information, you can infer that the stock is performing relatively well, as it is closer to its 52-week high than its 52-week low. This may indicate that the stock has positive momentum and could continue to rise in value.

Emily Bibb simplifies finance through bestselling books and articles, bridging complex concepts for everyday understanding. Engaging audiences via social media, she shares insights for financial success. Active in seminars and philanthropy, Bibb aims to create a more financially informed society, driven by her passion for empowering others.