
What is a Double Bottom Pattern?
A double bottom pattern is a technical analysis chart pattern that signals a potential reversal of a downtrend. It is formed when the price of an asset reaches a low point, bounces back up, and then falls again to a similar low point before reversing its direction and starting an uptrend. The pattern resembles the letter “W” and is considered a bullish reversal pattern.
To identify a double bottom pattern, traders look for two distinct lows that are approximately equal in price, with a peak in between. The lows should be separated by a period of time during which the price attempts to rally but fails to break above the previous peak. This failure to break resistance is a key characteristic of the pattern.
The double bottom pattern indicates that selling pressure has exhausted and buyers are stepping in to push the price higher. It suggests that the downtrend is losing momentum and a potential trend reversal is imminent. Traders often use this pattern as a signal to enter long positions, expecting the price to continue rising.
It is important to note that the double bottom pattern is not confirmed until the price breaks above the resistance level formed by the peak between the two lows. This breakout confirms the reversal and provides a potential target for the price movement based on the height of the pattern.
Traders can use various technical indicators and tools to confirm the double bottom pattern, such as volume analysis, trendlines, and moving averages. Additionally, it is essential to consider the overall market conditions and other factors that may influence the price movement.
Definition and Explanation
A double bottom pattern is a technical analysis chart pattern that signals a potential reversal in an asset’s price trend. It is formed when the price of an asset reaches a low point, bounces back up, and then falls again to a similar low point before reversing its trend and moving higher.
The double bottom pattern is considered a bullish reversal pattern, indicating that the downtrend may be coming to an end and a new uptrend may be starting. It is often seen as a sign of accumulation, where buyers are stepping in to support the price and prevent it from falling further.
Formation
When the price falls to the first bottom, it indicates that selling pressure is strong and the downtrend is in control. However, when the price bounces back up, it suggests that buyers are entering the market and pushing the price higher. The second bottom confirms the pattern and signals that buyers are still present, preventing the price from falling further.
Confirmation and Targets
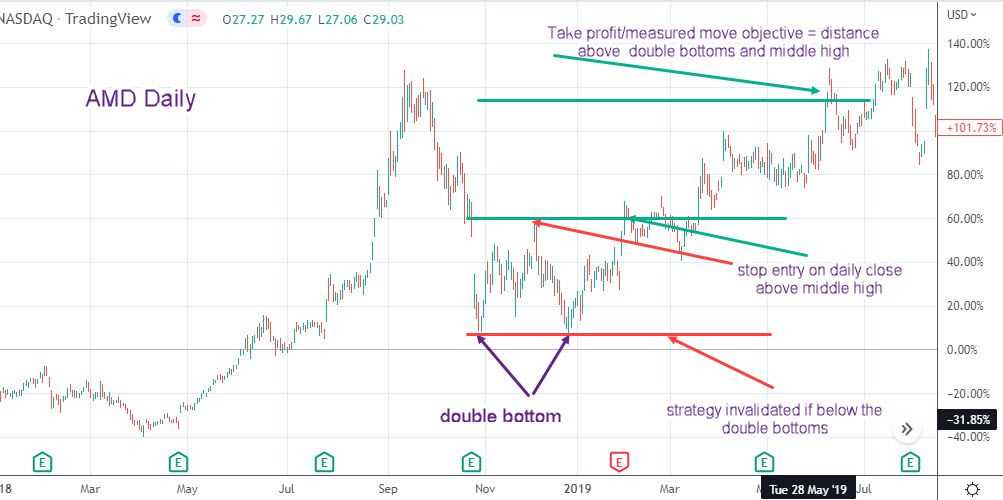
To confirm the double bottom pattern, traders look for the price to break above the neckline. This breakout is considered a bullish signal and suggests that the price may continue to rise. The distance from the neckline to the bottoms can be used to estimate a price target for the pattern. Traders often project this distance upward from the breakout point to determine a potential target for the price movement.
It is important to note that the double bottom pattern is not always a reliable indicator and should be used in conjunction with other technical analysis tools and indicators for confirmation. False breakouts and failed patterns can occur, so it is essential to consider the overall market context and other factors before making trading decisions based on this pattern.
Characteristics of a Double Bottom Pattern
A double bottom pattern is characterized by two distinct lows that are approximately equal in price, separated by a period of time where the price attempts to rally but fails to break through a resistance level. This pattern is usually formed after a prolonged downtrend and is considered a bullish reversal signal.
During the formation of the double bottom pattern, the price may experience a period of consolidation or sideways movement as buyers and sellers battle for control. This can be seen as a period of indecision in the market, where neither bulls nor bears have a clear advantage.
Once the second low is formed and the price starts to rise again, it is considered a confirmation of the pattern. Traders often look for additional signals, such as an increase in trading volume or a breakout above a resistance level, to confirm the validity of the pattern.
The price target for a double bottom pattern is often calculated by measuring the distance between the lowest low and the resistance level, and then adding that distance to the breakout point. This gives traders an idea of the potential upside if the pattern plays out as expected.
It is important to note that not all double bottom patterns will result in a successful reversal. Traders should always use other technical indicators and analysis techniques to confirm the pattern and assess the overall market conditions before making trading decisions.
Key Features and Signals of Double Bottom Patterns
A double bottom pattern is a bullish reversal pattern that forms after a downtrend. It is characterized by two consecutive lows that are approximately equal, followed by a breakout above the pattern’s neckline. Here are the key features and signals to look for when identifying and trading double bottom patterns:
1. Formation of the Double Bottom
The first step in identifying a double bottom pattern is to look for two distinct lows that are roughly at the same level. These lows should be separated by a peak or a slight pullback. The formation of the double bottom indicates that selling pressure is diminishing and buyers are stepping in.
2. Neckline
The neckline is a horizontal line drawn across the highs between the two lows of the double bottom pattern. It acts as a resistance level that needs to be broken for the pattern to be confirmed. The neckline can be drawn as a straight line or as a trendline connecting the highs.
3. Volume
Volume plays a crucial role in confirming the validity of the double bottom pattern. Ideally, the volume should be higher during the formation of the second low and decrease during the pullback or consolidation phase. A significant increase in volume during the breakout above the neckline is a strong signal of buying pressure.
4. Breakout Confirmation
The breakout above the neckline is the confirmation signal for the double bottom pattern. Traders should wait for a clear and decisive breakout with a significant increase in volume. The breakout should ideally occur on a closing basis to confirm the pattern’s validity.
5. Price Target
The price target for a double bottom pattern can be calculated by measuring the distance from the neckline to the lowest low of the pattern and projecting it upwards from the breakout point. This projected distance represents the potential price move after the breakout.
6. Stop Loss
A stop loss order should be placed below the lowest low of the double bottom pattern. This level acts as a support level, and if the price breaks below it, it indicates that the pattern has failed.
Trading Strategies for Double Bottom Patterns
Double bottom patterns can provide traders with valuable insights and opportunities for profitable trades. Here are some trading strategies that can be used when identifying and trading double bottom patterns:
1. Confirmation:
Before entering a trade based on a double bottom pattern, it is important to wait for confirmation. This can be done by waiting for the price to break above the neckline, which is the high point between the two bottoms. This breakout confirms the pattern and indicates a potential bullish trend reversal.
2. Entry and Stop Loss:
Traders can enter a long position once the price breaks above the neckline. The entry point can be set slightly above the neckline to ensure confirmation of the breakout. A stop loss can be placed below the lowest point of the double bottom pattern to limit potential losses if the pattern fails.
3. Target Price:
The target price for a trade based on a double bottom pattern can be calculated by measuring the distance between the lowest point of the pattern and the neckline. This distance can then be added to the breakout point to determine a potential target price. Traders can also use other technical analysis tools, such as support and resistance levels, to identify additional target prices.
4. Volume Analysis:
Volume can provide additional confirmation for a double bottom pattern. Traders can look for an increase in volume during the breakout above the neckline, which indicates strong buying pressure and further supports the validity of the pattern.
5. Timeframe Consideration:
Traders should consider the timeframe they are trading on when identifying and trading double bottom patterns. Patterns on longer timeframes, such as daily or weekly charts, tend to be more reliable and can provide stronger signals compared to patterns on shorter timeframes.
6. Risk Management:
How to Identify and Trade Double Bottoms
Identifying and trading double bottom patterns can be a profitable strategy for traders. Here are the steps to identify and trade double bottoms:
- Step 1: Look for a Downtrend
- Step 2: Spot the First Bottom
- Step 3: Wait for a Reversal
- Step 4: Look for the Second Bottom
- Step 5: Confirm the Pattern
- Step 6: Set Entry and Exit Points
- Step 7: Implement Risk Management
- Step 8: Monitor the Trade
The first step in identifying a double bottom pattern is to look for a downtrend in the price chart. This means that the price has been consistently decreasing over a period of time.
Once a downtrend is identified, the next step is to spot the first bottom. This is the lowest point reached by the price during the downtrend.
After the first bottom is identified, traders should wait for a reversal in the price. This means that the price starts to increase and shows signs of a potential trend change.
Once a reversal is observed, traders should look for the second bottom. This is the point where the price reaches a similar or slightly higher level compared to the first bottom.
To confirm the double bottom pattern, traders should look for a breakout above the resistance level formed by the highs between the two bottoms. This breakout indicates a potential trend reversal.
Once the double bottom pattern is confirmed, traders can set their entry and exit points. The entry point is usually set above the resistance level, while the exit point can be set at a predetermined target or based on other technical indicators.
It is important to implement proper risk management techniques when trading double bottom patterns. This includes setting stop-loss orders to limit potential losses and adjusting position sizes based on risk tolerance.
After entering a trade based on a double bottom pattern, it is crucial to monitor the trade and make adjustments if necessary. Traders should be prepared to exit the trade if the price fails to continue the expected trend reversal.
By following these steps, traders can effectively identify and trade double bottom patterns in the market. However, it is important to note that no trading strategy is foolproof, and it is always recommended to use additional analysis and risk management techniques when making trading decisions.
Examples of Double Bottom Patterns
Double bottom patterns can be found in various financial markets, including stocks, forex, and commodities. Here are some examples of double bottom patterns:
- Forex Example: The EUR/USD currency pair has been declining for a while. It reaches a low point and bounces back, but fails to sustain the upward momentum. After a period of consolidation, the pair finds support at the previous low and starts to rally. This creates a double bottom pattern, suggesting a possible trend reversal.
- Commodity Example: Gold prices have been falling for some time. The price reaches a bottom and experiences a minor recovery. However, it faces resistance and retraces back to the previous low. Eventually, gold finds support at the same level and begins to climb again. This forms a double bottom pattern, indicating a potential shift in the downtrend.

Emily Bibb simplifies finance through bestselling books and articles, bridging complex concepts for everyday understanding. Engaging audiences via social media, she shares insights for financial success. Active in seminars and philanthropy, Bibb aims to create a more financially informed society, driven by her passion for empowering others.