What is Optimization and Why is it Important?

Optimization is a crucial concept in technical analysis that involves finding the best possible parameters or variables for a given trading strategy. It is the process of fine-tuning a strategy to maximize its performance and profitability.
Optimization is important because it allows traders to adapt their strategies to changing market conditions. Markets are dynamic and constantly evolving, so a strategy that worked well in the past may not perform as well in the future. By optimizing their strategies, traders can ensure that they are using the most effective settings for the current market environment.
Another reason why optimization is important is that it helps traders avoid overfitting. Overfitting occurs when a strategy is too closely tailored to historical data and performs poorly on new, unseen data. By optimizing a strategy using out-of-sample data, traders can reduce the risk of overfitting and increase the likelihood of its success in real-world trading.
The Process of Optimization
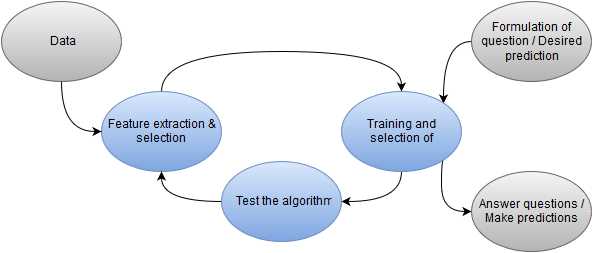
The process of optimization involves several steps. First, traders need to define the parameters or variables that make up their trading strategy. These could include indicators, moving averages, entry and exit rules, or any other components of the strategy.
Next, traders need to determine the range of values that each parameter can take. This range will depend on the specific strategy and the characteristics of the market being traded. For example, if a trader is optimizing a moving average crossover strategy, they may test different values for the length of the moving averages.
Once the parameters and their ranges are defined, traders can use optimization techniques to find the best combination of values. This can be done manually by testing different values and observing the strategy’s performance, or it can be automated using specialized software or programming languages.
After running the optimization process, traders need to evaluate the results and select the best set of parameters. This involves analyzing performance metrics such as profit, drawdown, win rate, and risk-adjusted returns. Traders should also consider factors such as stability, robustness, and the ability to adapt to different market conditions.
Limitations and Considerations

To avoid over-optimization, traders should use out-of-sample testing and robustness checks to validate the performance of their optimized strategies. They should also be cautious of data snooping bias, which can occur when multiple iterations of optimization are performed on the same dataset.
Furthermore, optimization should be used in conjunction with other analytical tools and techniques. It is not a standalone solution for successful trading. Traders should consider factors such as market fundamentals, macroeconomic conditions, and risk management principles when developing and optimizing their strategies.
Examples of Optimization in Technical Analysis

Optimization is a crucial aspect of technical analysis as it allows traders and investors to find the best parameters for their trading strategies. Here are some examples of how optimization is used in technical analysis:
- Moving Averages: Traders often use moving averages to identify trends in the market. By optimizing the length of the moving average, traders can find the optimal period that provides the most accurate signals. For example, a short-term moving average may be more suitable for day trading, while a longer-term moving average may be better for long-term investing.
- RSI (Relative Strength Index): The RSI is a popular technical indicator used to identify overbought and oversold conditions in the market. Traders can optimize the period of the RSI to find the most effective level for generating trading signals. Different timeframes may require different RSI periods, so optimization helps traders adapt their strategy to different market conditions.
- Bollinger Bands: Bollinger Bands are volatility indicators that consist of a moving average and two standard deviation bands. Traders can optimize the length of the moving average and the standard deviation to find the best parameters for their trading strategy. By adjusting these parameters, traders can adapt to different market conditions and improve the accuracy of their trading signals.
These are just a few examples of how optimization is used in technical analysis. By finding the optimal parameters for different technical indicators and trading strategies, traders can improve their decision-making process and increase their chances of success in the market.

Emily Bibb simplifies finance through bestselling books and articles, bridging complex concepts for everyday understanding. Engaging audiences via social media, she shares insights for financial success. Active in seminars and philanthropy, Bibb aims to create a more financially informed society, driven by her passion for empowering others.
