
Mortality Table Definition
Types of Mortality Tables
There are different types of mortality tables, each designed for specific purposes:
1. Static Mortality Tables: These tables are based on historical data and provide mortality rates for a specific period of time. They are commonly used for pricing life insurance policies and annuities.
2. Cohort Mortality Tables: These tables are based on the mortality experience of a specific group of individuals born in the same year. They are useful for analyzing mortality trends and projecting future mortality rates.
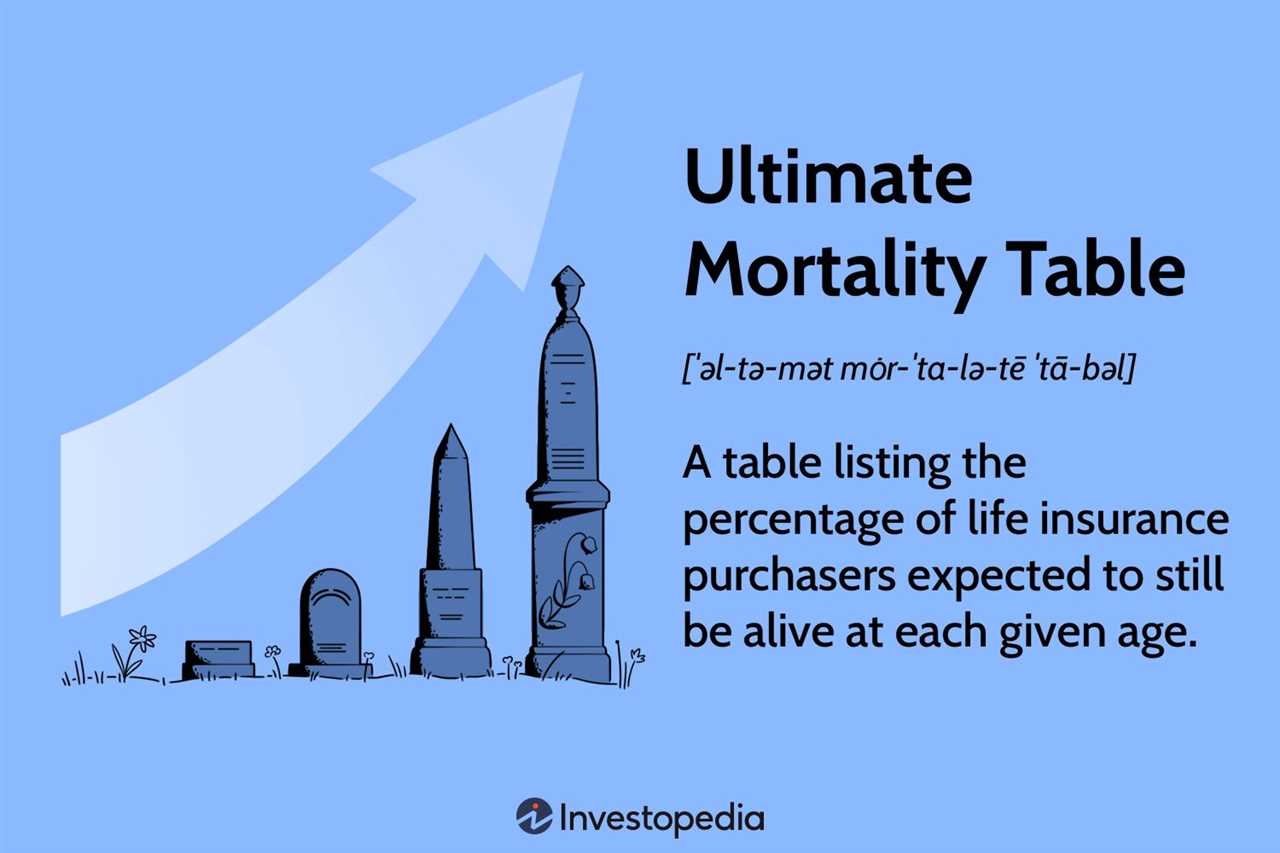
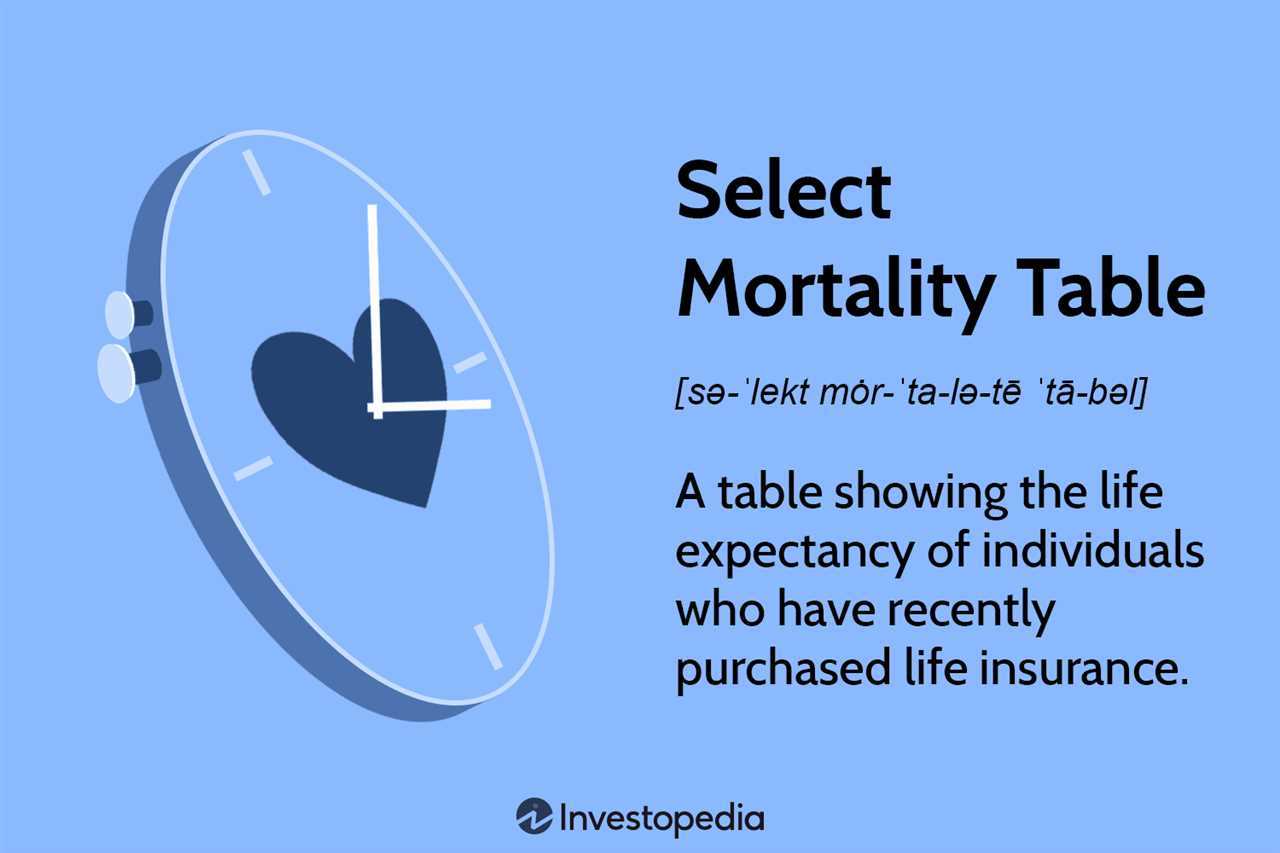
3. Select and Ultimate Mortality Tables: Select mortality tables are used to estimate mortality rates for a specific subset of the population, such as individuals who have passed a certain medical examination. Ultimate mortality tables, on the other hand, provide mortality rates for the entire population.
Uses of Mortality Tables
Mortality tables have several important uses:
1. Insurance Pricing: Insurance companies use mortality tables to calculate premiums for life insurance policies and annuities. By estimating the probability of death at different ages, they can determine the appropriate level of risk and set the premiums accordingly.
2. Pension Fund Management: Pension funds rely on mortality tables to estimate the life expectancy of their members and calculate the amount of benefits to be paid. This helps them manage their financial obligations and ensure the long-term sustainability of the fund.
4. Actuarial Science Research: Mortality tables are also used for research purposes in the field of actuarial science. Actuaries analyze mortality trends and develop new models to improve the accuracy of mortality projections and risk assessments.
What is a Mortality Table?
Mortality tables are typically constructed based on historical data and are used by insurance companies, pension funds, and other financial institutions to assess the risk associated with providing life insurance policies or pension benefits. They help these institutions determine the appropriate premiums or contributions to ensure the financial stability of their operations.
Components of a Mortality Table
A mortality table consists of several key components:
- Age: The age at which the mortality rates are calculated.
- lx: The number of individuals alive at the beginning of a given age interval.
- dx: The number of individuals dying within a given age interval.
- px: The probability of surviving to a given age.
- lx+1: The number of individuals alive at the end of a given age interval.
- qx+1: The probability of dying between a given age interval and the next.
Types of Mortality Tables
There are various types of mortality tables, each tailored to a specific purpose:
- Period Life Table: Provides mortality rates for a specific period of time, such as a year.
- Cohort Life Table: Follows a specific group of individuals throughout their lifetime, providing mortality rates at different ages.
- Select and Ultimate Life Table: Differentiates between select mortality rates for a specific group and ultimate mortality rates for the general population.
- Generational Life Table: Projects mortality rates for future generations based on historical data.
Uses of Mortality Tables
Mortality tables have several important uses:
- Insurance Pricing: Insurance companies use mortality tables to determine the premiums for life insurance policies based on the risk of death at different ages.
- Pension Planning: Pension funds use mortality tables to calculate the expected life spans of retirees and determine the appropriate contributions needed to fund their pension benefits.
- Population Studies: Demographers and researchers use mortality tables to analyze and compare mortality rates among different populations or demographic groups.
- Actuarial Analysis: Actuaries use mortality tables to assess the financial risks associated with providing insurance or pension benefits and make informed decisions.
Types of Mortality Tables
Mortality tables are classified into different types based on the specific characteristics they consider and the purpose they serve. Here are some common types of mortality tables:
| Type | Description |
|---|---|
| Period Life Table | This type of table provides information on the probability of survival and the number of years a person is expected to live at different ages. It is based on the mortality experience of a specific population during a particular period of time. |
| Cohort Life Table | |
| Select and Ultimate Life Table | This type of table is commonly used in life insurance and annuity calculations. It separates the mortality rates into two categories: select mortality rates for a specific group of insured individuals and ultimate mortality rates for the general population. The select rates are used for pricing and underwriting purposes, while the ultimate rates are used for long-term projections. |
| Aggregate Mortality Table | An aggregate mortality table combines the mortality experience of multiple populations or cohorts to provide a broader view of mortality patterns. It is often used for analyzing mortality trends on a larger scale, such as for demographic studies or actuarial calculations. |
These are just a few examples of the types of mortality tables that exist. Each type serves a specific purpose and provides valuable insights into mortality patterns and life expectancy. Insurance companies, pension funds, and other organizations use these tables to assess risk, calculate premiums, and make informed decisions related to mortality and longevity.
Uses of Mortality Tables
1. Insurance Industry
One of the primary uses of mortality tables is in the insurance industry. Insurance companies rely on these tables to assess the risk associated with providing life insurance policies and annuities. By analyzing mortality rates, insurers can determine the premiums to charge and the benefits to offer. Mortality tables help insurers estimate the likelihood of policyholders dying and calculate the expected payouts.
Mortality tables are also used in the underwriting process, where insurers evaluate the health and lifestyle factors of potential policyholders. These tables provide a standardized framework for assessing risk and determining the appropriate coverage and pricing.
2. Pension Planning
Mortality tables are crucial in pension planning, especially for defined benefit pension plans. These tables help pension fund managers estimate the life expectancies of plan participants and calculate the required funding levels. By considering mortality rates, pension funds can ensure they have sufficient assets to meet the future obligations of retirees.
Additionally, mortality tables are used in calculating annuity payments for retirees. By incorporating mortality rates, annuity providers can determine the appropriate payout amounts based on the life expectancy of the annuitant.
3. Government Policy and Social Security
Mortality tables play a vital role in government policy and social security planning. Governments use these tables to assess the financial sustainability of social security programs and design retirement policies. By analyzing mortality rates, policymakers can determine the appropriate retirement age, benefit levels, and contribution rates.
Mortality tables also help governments estimate the future population and plan for healthcare and social welfare programs. These tables provide insights into the aging population and the potential impact on healthcare costs, pension liabilities, and labor force dynamics.
4. Research and Demographic Studies
Mortality tables are extensively used in research and demographic studies. Researchers analyze mortality rates to understand population dynamics, health trends, and the impact of various factors on mortality. These tables provide valuable insights into disease patterns, life expectancy disparities, and the effectiveness of healthcare interventions.
Demographers use mortality tables to study population growth, aging, and migration patterns. These tables help demographers forecast future population sizes, assess the impact of demographic changes on society, and plan for infrastructure, healthcare, and social services.
Corporate Insurance and Mortality Tables
Corporate insurance is a type of insurance that is purchased by businesses to protect themselves from various risks and liabilities. One important aspect of corporate insurance is the use of mortality tables.
A mortality table is a statistical tool that is used to calculate the probability of death at different ages. It provides valuable information about the mortality rates of a specific population and helps insurance companies determine the premiums for life insurance policies.
In addition to life insurance, mortality tables are also used in other types of corporate insurance, such as pension plans and annuities. These tables help companies determine the funding requirements for these plans and ensure that they have enough assets to meet their future obligations.

Emily Bibb simplifies finance through bestselling books and articles, bridging complex concepts for everyday understanding. Engaging audiences via social media, she shares insights for financial success. Active in seminars and philanthropy, Bibb aims to create a more financially informed society, driven by her passion for empowering others.