
Hanging Man Candlestick Definition and Tactics
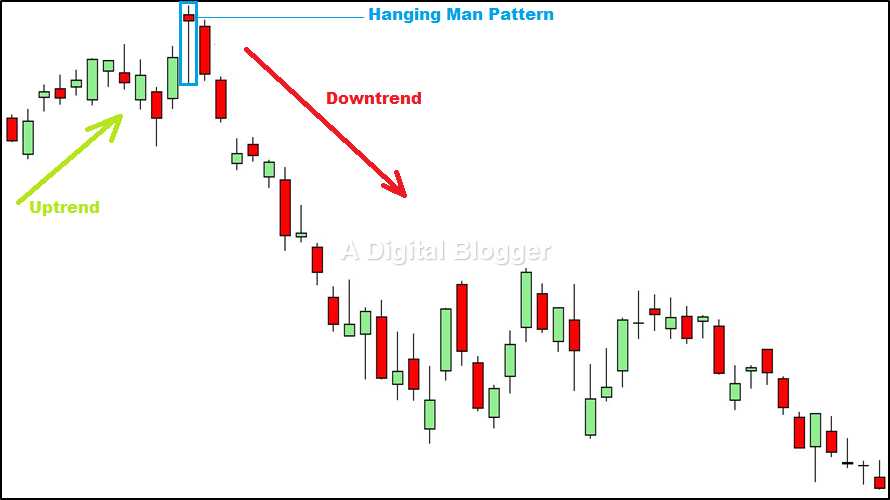
A hanging man candlestick is a bearish reversal pattern that occurs at the top of an uptrend. It is characterized by a small body and a long lower shadow, which represents the rejection of higher prices by the market. The pattern is named “hanging man” because it looks like a person hanging from a rope.
To identify a hanging man candlestick, look for the following characteristics:
| 1. Small Body: | The body of the candlestick should be small, indicating indecision between buyers and sellers. |
| 2. Long Lower Shadow: | The lower shadow should be at least twice the size of the body and should extend below the previous candlestick’s low. |
| 3. Little to No Upper Shadow: | The hanging man candlestick should have little to no upper shadow, indicating that there was little to no buying pressure during the session. |
The hanging man candlestick pattern suggests that the buying pressure is starting to weaken and that a reversal may be imminent. However, it is important to confirm the pattern with additional signals or indicators before making any trading decisions.
Here are some tactics to consider when trading the hanging man candlestick pattern:
- Confirmation: Look for confirmation of the pattern through other technical indicators or chart patterns. This can help increase the probability of a successful trade.
- Stop Loss: Place a stop loss order above the high of the hanging man candlestick to limit potential losses if the market moves against your position.
- Profit Target: Set a profit target based on your risk-reward ratio. This can be determined by measuring the distance between the entry point and the stop loss level.
- Volume: Consider the volume during the formation of the hanging man candlestick. A higher volume can provide further confirmation of the pattern.
- Additional Indicators: Use additional technical indicators, such as moving averages or oscillators, to support your trading decision.
Remember, the hanging man candlestick pattern is just one tool in a trader’s toolbox. It should be used in conjunction with other technical analysis tools and indicators to make informed trading decisions.
The hanging man candlestick pattern is a bearish reversal pattern that appears at the top of an uptrend. It is characterized by a small body and a long lower shadow, which resembles a hanging man. This pattern indicates that the buyers were initially in control but lost momentum, allowing the sellers to take over.
Identification
To identify a hanging man candlestick pattern, look for the following characteristics:
- A small body, which can be either bullish or bearish.
- A long lower shadow that is at least twice the length of the body.
- No or very little upper shadow.
It is important to note that the color of the body does not play a significant role in identifying the hanging man pattern. However, a bearish (red or black) body is considered more bearish than a bullish (green or white) body.
Meaning
The hanging man candlestick pattern signifies a potential reversal in the market. It suggests that the buyers have lost control and the sellers are gaining strength. The long lower shadow indicates that the price dropped significantly from the session high, but managed to recover some ground by the close.
This pattern is often seen as a warning sign for traders who are long on a particular asset. It suggests that the uptrend may be coming to an end and that a bearish trend could be imminent.
Confirmation and Trading Strategies
While the hanging man candlestick pattern is a strong indication of a potential reversal, it is always important to look for confirmation before taking any trading action. Traders often wait for the next candlestick to confirm the reversal.
There are several trading strategies that can be used when the hanging man candlestick pattern is identified:
- Shorting: Traders can consider shorting the asset once the reversal is confirmed. They can place a stop-loss order above the high of the hanging man candlestick and a take-profit order at a predetermined target.
- Exiting long positions: Traders who are long on the asset can consider closing their positions once the hanging man pattern is identified. This can help them avoid potential losses if the reversal is confirmed.
- Waiting for confirmation: Some traders prefer to wait for additional confirmation before taking any action. They may look for other technical indicators or patterns to support the reversal signal.
It is important to note that no trading strategy is foolproof, and traders should always use proper risk management techniques when trading based on candlestick patterns.
Interpreting the Hanging Man Candlestick Pattern
The hanging man candlestick pattern is a bearish reversal pattern that can indicate a potential trend reversal in the market. It is formed when the price opens near the high of the session, then falls significantly during the session, and closes near the low of the session. The resulting candlestick looks like a hanging man, hence the name.
When interpreting the hanging man candlestick pattern, it is important to consider the context in which it appears. The pattern is most significant when it occurs after an uptrend, as it suggests that the bulls are losing control and the bears may be taking over. It can also be a warning sign of a potential trend reversal.
There are a few key factors to consider when interpreting the hanging man candlestick pattern:
1. Body Length
The length of the body of the hanging man candlestick is an important factor to consider. A longer body indicates a stronger bearish sentiment, while a shorter body suggests a weaker bearish sentiment. Traders should pay attention to the size of the body relative to previous candlesticks to determine the strength of the bearish reversal signal.
2. Upper Shadow
3. Lower Shadow
The lower shadow of the hanging man candlestick represents the low of the session. If the lower shadow is short or non-existent, it suggests that the bears were in control throughout the session and there was little to no buying pressure. This reinforces the bearish sentiment of the pattern.
Traders should also consider other technical indicators and patterns that may confirm or contradict the hanging man candlestick pattern. For example, if the hanging man pattern appears near a significant support level, it may increase the likelihood of a trend reversal. Conversely, if the hanging man pattern appears in isolation without any other supporting factors, it may be less reliable.
It is important to wait for confirmation before making any trading decisions based on the hanging man candlestick pattern. Traders should look for a follow-up candlestick or other technical signals that confirm the bearish reversal. This can help reduce the risk of false signals and increase the probability of a successful trade.
Trading Tactics for Hanging Man Candlestick
Confirmation with Volume
One tactic is to confirm the Hanging Man pattern with volume. Typically, a Hanging Man candlestick pattern accompanied by high trading volume is considered more reliable. This suggests that there is strong selling pressure and reinforces the bearishness of the pattern. Conversely, a Hanging Man pattern with low volume may be less significant and could be a false signal.
Confirmation with Support and Resistance Levels
Another tactic is to look for confirmation of the Hanging Man pattern with support and resistance levels. If the Hanging Man candlestick forms near a key support level, it could indicate a potential reversal in the downtrend. Similarly, if the pattern forms near a resistance level, it could suggest a continuation of the downtrend. Traders can use other technical analysis tools, such as trendlines or moving averages, to identify these support and resistance levels.
Wait for Confirmation Candlestick
Traders can also wait for a confirmation candlestick to form after the Hanging Man pattern. This can help validate the signal and provide additional confirmation of a potential reversal or continuation. For example, if a bullish candlestick forms after the Hanging Man pattern, it could indicate a bullish reversal. Conversely, if a bearish candlestick forms, it could suggest a continuation of the bearish trend.
Combine with Other Technical Indicators
Traders can enhance their trading tactics by combining the Hanging Man pattern with other technical indicators. For example, they can use oscillators like the Relative Strength Index (RSI) or the Moving Average Convergence Divergence (MACD) to confirm the signal. If these indicators show oversold conditions or bearish momentum, it can strengthen the validity of the Hanging Man pattern.
Implement Proper Risk Management
Lastly, it is crucial for traders to implement proper risk management techniques when trading the Hanging Man candlestick pattern. This includes setting stop-loss orders to limit potential losses and using appropriate position sizing based on their risk tolerance. Traders should also consider the overall market conditions and other fundamental factors that may impact the trade.
| Trading Tactics for Hanging Man Candlestick |
|---|
| Confirmation with Volume |
| Confirmation with Support and Resistance Levels |
| Wait for Confirmation Candlestick |
| Combine with Other Technical Indicators |
| Implement Proper Risk Management |

Emily Bibb simplifies finance through bestselling books and articles, bridging complex concepts for everyday understanding. Engaging audiences via social media, she shares insights for financial success. Active in seminars and philanthropy, Bibb aims to create a more financially informed society, driven by her passion for empowering others.