What is Regression: Definition, Calculation, and Example

Regression is a statistical method used to analyze the relationship between a dependent variable and one or more independent variables. It is commonly used in various fields, including economics, finance, and social sciences, to understand and predict the behavior of a variable based on other variables.
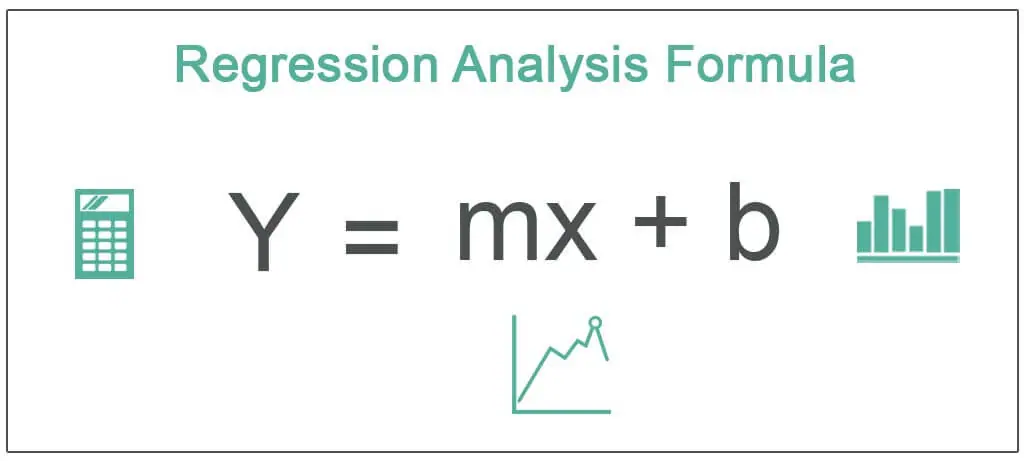
The main goal of regression analysis is to find the best-fitting line or curve that represents the relationship between the dependent variable and the independent variables. This line or curve is called the regression line or regression curve.
Regression analysis provides several useful outputs, including the equation of the regression line or curve, which can be used to predict the values of the dependent variable for given values of the independent variables. It also provides information about the strength and significance of the relationship between the variables.
For example, in economics, regression analysis can be used to analyze the relationship between GDP growth (dependent variable) and factors such as government spending, inflation, and interest rates (independent variables). By analyzing historical data and estimating the regression equation, economists can make predictions about the future behavior of GDP based on changes in the independent variables.
Regression analysis is a statistical technique used in macroeconomics to understand the relationship between different economic variables. It helps economists to analyze and predict how changes in one variable can affect another variable. By using regression analysis, economists can identify the strength and direction of the relationship between variables, as well as estimate the impact of changes in one variable on another.
Regression analysis involves fitting a line or curve to a set of data points, with the goal of minimizing the difference between the predicted values and the actual values. This line or curve represents the best-fit relationship between the variables being studied. The equation of the line or curve can then be used to estimate the value of one variable based on the value of another variable.
For example, regression analysis can be used to understand the relationship between GDP and inflation. By analyzing historical data, economists can determine how changes in GDP have affected inflation rates in the past. This information can then be used to predict how changes in GDP may impact inflation in the future.
Regression analysis also allows economists to quantify the strength of the relationship between variables. The coefficient of determination, or R-squared value, measures the proportion of the variation in one variable that can be explained by changes in another variable. A high R-squared value indicates a strong relationship between the variables, while a low R-squared value suggests a weak relationship.

Emily Bibb simplifies finance through bestselling books and articles, bridging complex concepts for everyday understanding. Engaging audiences via social media, she shares insights for financial success. Active in seminars and philanthropy, Bibb aims to create a more financially informed society, driven by her passion for empowering others.
