
Meaning of the Doji Dragonfly Candlestick
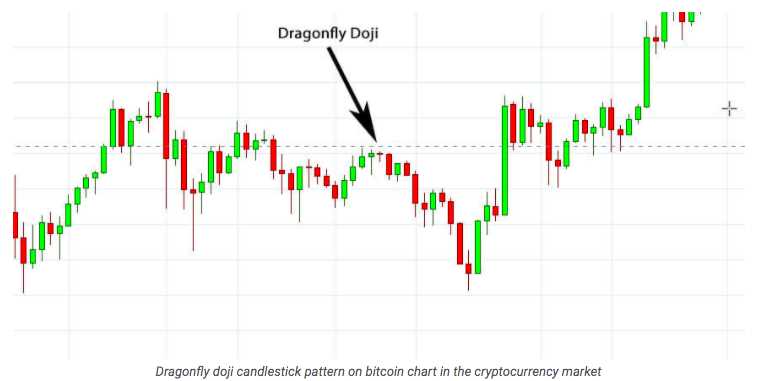
The Doji Dragonfly candlestick is a powerful reversal pattern that can provide valuable insights into market sentiment and potential trend changes. It is characterized by a long lower shadow, no upper shadow, and a small body located at the top of the candlestick.
This candlestick pattern is formed when the opening and closing prices are at or near the high of the session, indicating that buyers were able to push the price up significantly from the lows. The long lower shadow represents the rejection of lower prices and the strength of the buyers.
The Doji Dragonfly candlestick is often seen at the bottom of a downtrend, signaling a potential reversal to an uptrend. It suggests that sellers have exhausted their selling pressure and buyers are stepping in to take control. This can be a bullish signal for traders looking to enter long positions.
However, it is important to consider other factors and confirmations before making trading decisions based solely on the Doji Dragonfly candlestick. Traders should look for additional technical indicators or chart patterns that support the potential reversal.
Furthermore, the Doji Dragonfly candlestick can also be seen as a sign of indecision in the market. It indicates that buyers and sellers are in equilibrium and the direction of the next move is uncertain. In such cases, traders may need to wait for further confirmation before taking any action.
Overall, the Doji Dragonfly candlestick is a valuable tool for technical analysis, providing insights into market sentiment and potential trend reversals. Traders should use it in conjunction with other indicators and confirmations to make well-informed trading decisions.
Examples of the Doji Dragonfly Candlestick
The Doji Dragonfly candlestick is a unique pattern that can provide valuable insights into market trends and potential reversals. Here are a few examples of how this candlestick pattern can be identified and interpreted:
Example 1:
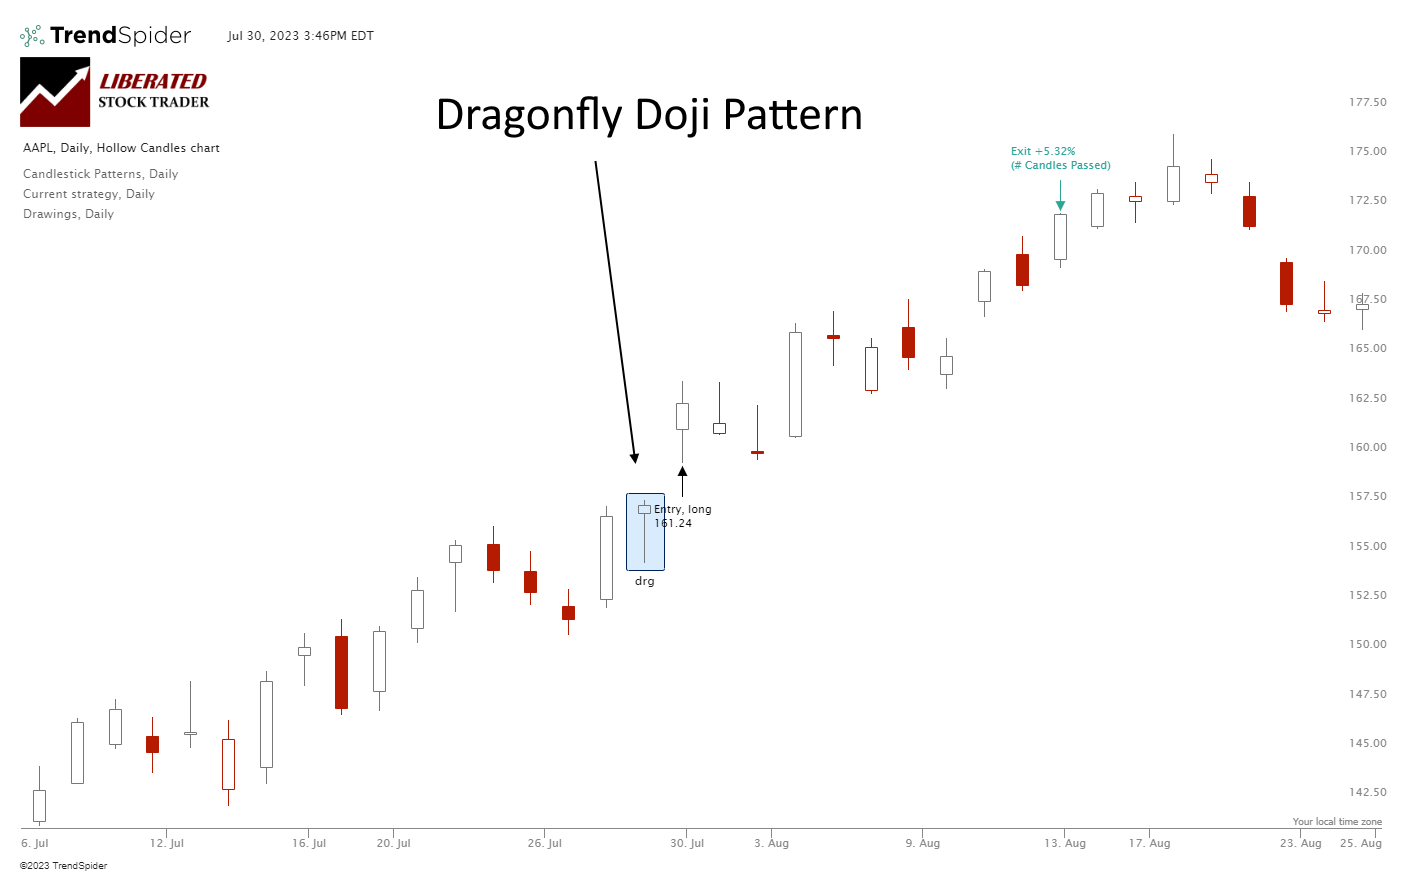
On a daily chart of XYZ stock, a Doji Dragonfly candlestick appears after a prolonged downtrend. The open, high, and close prices are all at the same level, forming a small body with a long lower shadow. This indicates that the sellers were initially in control, pushing the price lower, but the buyers stepped in and pushed the price back up, resulting in a potential reversal. Traders may interpret this as a signal to go long or close their short positions.
Example 2:
During an uptrend in the forex market, a Doji Dragonfly candlestick forms on a 4-hour chart. The open and close prices are at the high of the candlestick, while the low forms a long lower shadow. This suggests that the buyers were initially in control, pushing the price higher, but the sellers managed to push it back down. Traders may see this as a sign of potential weakness in the uptrend and consider taking profits or tightening their stop-loss orders.
Example 3:
On a weekly chart of a cryptocurrency, a Doji Dragonfly candlestick pattern emerges after a period of consolidation. The open, high, and close prices are all at the same level, forming a small body with a long lower shadow. This indicates that the buyers were able to push the price higher, but the sellers managed to bring it back down. Traders may interpret this as a sign of indecision in the market and wait for confirmation before taking any trading actions.
These examples illustrate how the Doji Dragonfly candlestick pattern can be identified and used in different market scenarios. It is important to note that this pattern should not be used in isolation but rather in conjunction with other technical analysis tools and indicators to confirm potential reversals or trend continuations.
Disclaimer: The examples provided are for illustrative purposes only and do not constitute financial advice. Trading in the financial markets carries a high level of risk and may not be suitable for all investors.

Emily Bibb simplifies finance through bestselling books and articles, bridging complex concepts for everyday understanding. Engaging audiences via social media, she shares insights for financial success. Active in seminars and philanthropy, Bibb aims to create a more financially informed society, driven by her passion for empowering others.