
Key Differences
Horizontal analysis and vertical analysis are two commonly used techniques in financial statement analysis. While both methods aim to provide insights into a company’s financial performance, they differ in their approach and focus.
Horizontal Analysis
One key difference between horizontal analysis and vertical analysis is the direction of comparison. In horizontal analysis, the focus is on comparing figures across time periods, such as year-on-year or quarter-on-quarter. This allows analysts to assess the company’s growth or decline over time.
Horizontal analysis is often presented in the form of a horizontal financial statement, where the figures for each period are displayed side by side. This visual representation makes it easier to identify trends and spot any significant changes in the financial data.
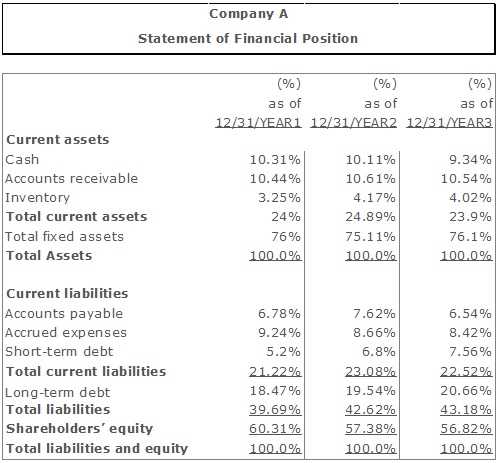
Vertical Analysis
Unlike horizontal analysis, which looks at changes over time, vertical analysis provides a snapshot of a company’s financial structure at a specific point in time. It helps to identify the composition and significance of different items in the financial statements.
Vertical analysis is often presented in the form of a vertical financial statement, where each item is expressed as a percentage of a base figure, such as total revenue or total assets. This allows analysts to compare the relative importance of different items and assess their impact on the overall financial performance.
Benefits of Horizontal and Vertical Analysis
Horizontal and vertical analysis are two important tools used in financial analysis to evaluate the performance and financial health of a company. Both methods have their own benefits and can provide valuable insights into the company’s financial statements.
Here are some of the key benefits of using horizontal and vertical analysis:
- Highlighting changes and variances: Horizontal analysis helps in identifying changes and variances in the financial statements. By comparing the financial data over time, analysts can easily spot any significant changes in revenue, expenses, or other key financial metrics. Vertical analysis, on the other hand, helps in identifying changes in the composition of the financial statements. By comparing the percentages of different components, analysts can identify any significant shifts in the company’s financial structure.
- Evaluating performance and profitability: Both horizontal and vertical analysis provide insights into the company’s performance and profitability. Horizontal analysis helps in evaluating the company’s growth rate and trend in revenue, expenses, and other financial metrics. Vertical analysis helps in evaluating the company’s efficiency and profitability by comparing the percentages of expenses, assets, and liabilities.
- Comparing with industry benchmarks: Horizontal and vertical analysis can be used to compare a company’s financial performance with industry benchmarks. By comparing the company’s financial ratios and percentages with industry averages, analysts can assess the company’s competitiveness and position in the industry.
- Identifying areas of improvement: Both horizontal and vertical analysis can help in identifying areas of improvement for the company. By analyzing the trends and variances in the financial statements, analysts can identify areas where the company is performing well and areas where it needs to improve. This can help in making informed decisions and developing strategies to enhance the company’s financial performance.

Emily Bibb simplifies finance through bestselling books and articles, bridging complex concepts for everyday understanding. Engaging audiences via social media, she shares insights for financial success. Active in seminars and philanthropy, Bibb aims to create a more financially informed society, driven by her passion for empowering others.