
Supply Curve Definition

The supply curve is a graphical representation of the relationship between the quantity of a good or service that suppliers are willing and able to produce and the price of that good or service. It is a fundamental concept in microeconomics that helps us understand how producers respond to changes in market conditions.
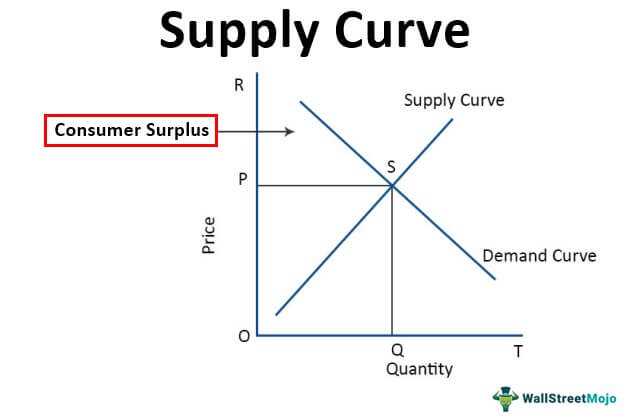
The supply curve is typically represented graphically as a line on a graph, with price on the vertical axis and quantity on the horizontal axis. Each point on the supply curve represents a specific price-quantity combination, showing the quantity that suppliers are willing to produce and sell at a given price.
It is important to note that the supply curve represents the behavior of individual suppliers or firms in a market. The aggregate supply curve, which represents the behavior of all suppliers in a market, is derived by summing up the individual supply curves of all firms.
| Price | Quantity Supplied |
|---|---|
| $10 | 100 |
| $20 | 200 |
| $30 | 300 |
| $40 | 400 |
The supply curve is a fundamental concept in microeconomics that illustrates the relationship between the price of a product and the quantity of that product that suppliers are willing and able to produce and sell. It is a graphical representation that shows the quantity supplied at different price levels, assuming all other factors remain constant.
Let’s understand how the supply curve works with an example:
Example: Supply Curve for Apples
Suppose we are analyzing the supply of apples in a local market. The price of apples is determined by the interaction of supply and demand in the market. Let’s assume that the market price of apples is $2 per pound.
At this price, apple farmers are willing and able to supply 100 pounds of apples per day. This quantity supplied is represented by a point on the supply curve.
Let’s say that at $3 per pound, apple farmers are willing and able to supply 150 pounds of apples per day. This new quantity supplied is represented by another point on the supply curve.
As we can see, there is a positive relationship between the price of apples and the quantity supplied. This relationship is illustrated by the upward-sloping supply curve. When the price increases, suppliers are incentivized to produce and sell more of the product.
It is important to note that the supply curve assumes that all other factors affecting supply, such as input costs, technology, and government regulations, remain constant. In reality, these factors can change, causing shifts in the supply curve.

Emily Bibb simplifies finance through bestselling books and articles, bridging complex concepts for everyday understanding. Engaging audiences via social media, she shares insights for financial success. Active in seminars and philanthropy, Bibb aims to create a more financially informed society, driven by her passion for empowering others.