
Intraday Momentum Index Overview
The Intraday Momentum Index (IMI) is a technical analysis indicator that measures the strength and direction of intraday price movements. It is used by traders to identify potential buying or selling opportunities in the short term.
The IMI is calculated based on the relationship between the current price and the price range over a specified period of time. It compares the price movement of each individual bar within the period to the overall price movement of the period. This calculation helps to identify whether the market is trending up or down and whether there is a potential reversal in the price movement.
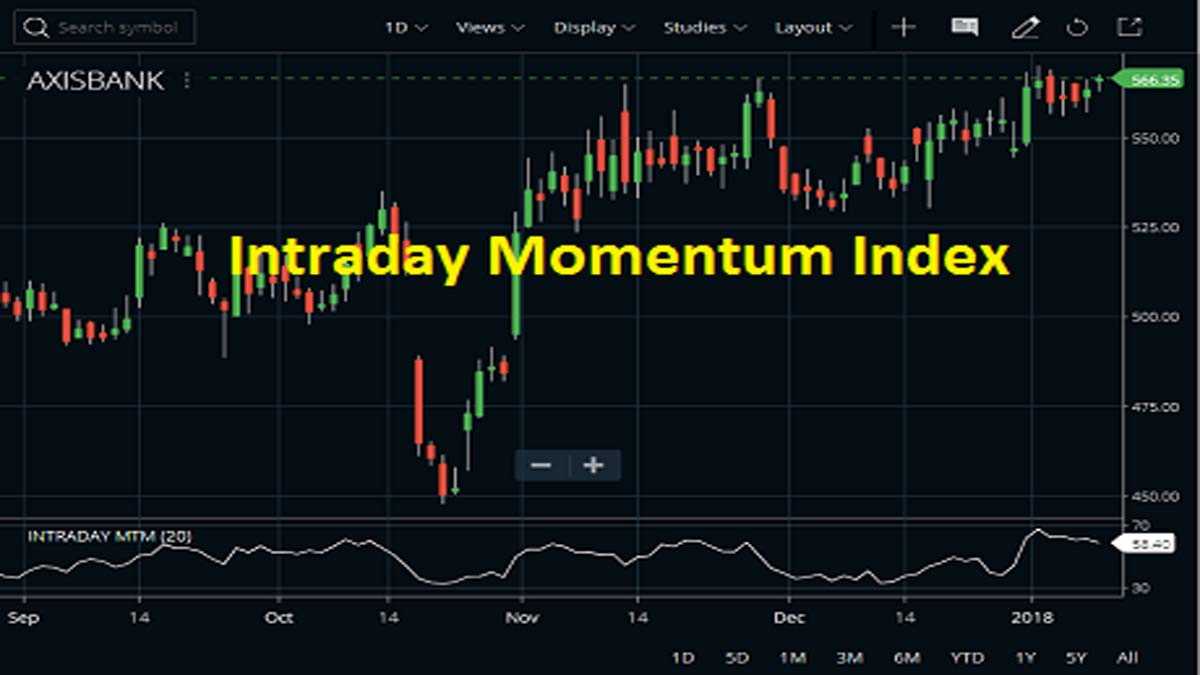
The IMI is typically displayed as a line chart that oscillates between 0 and 100. A reading above 50 indicates bullish momentum, while a reading below 50 indicates bearish momentum. Traders often look for divergences between the IMI and the price chart to identify potential trend reversals.
- The Intraday Momentum Index (IMI) measures the strength and direction of intraday price movements.
- The IMI compares the price movement of each individual bar within a specified period to the overall price movement of the period.
- A reading above 50 indicates bullish momentum, while a reading below 50 indicates bearish momentum.
- The IMI is a short-term indicator and should be used in conjunction with other technical analysis tools.
Formula Examples
The Intraday Momentum Index (IMI) is a technical analysis indicator that is used to identify potential reversals in the price trend of a security. It is calculated based on the relationship between the current price and the price range over a specified period of time.
Calculation
The formula for calculating the Intraday Momentum Index is as follows:
IMI = (Up-Move / Up-Move + Down-Move) * 100
Where:
- Up-Move is the sum of all price changes that occur on up days (days when the closing price is higher than the previous closing price).
- Down-Move is the sum of all price changes that occur on down days (days when the closing price is lower than the previous closing price).
The resulting value is then multiplied by 100 to obtain a percentage value.
Example
Let’s say we want to calculate the Intraday Momentum Index for a security over a 10-day period. Here are the closing prices for the 10 days:
Day 1: $10
Day 2: $12
Day 3: $11
Day 4: $13
Day 5: $14
Day 6: $15
Day 7: $14
Day 8: $13
Day 9: $12
Day 10: $11
To calculate the Up-Move and Down-Move, we need to determine the price changes for each day:
Day 1: Up-Move = 0 (no previous closing price)
Now we can calculate the Intraday Momentum Index for the 10-day period:
IMI = (Up-Move / Up-Move + Down-Move) * 100
IMI = ($2 / $2 + (-$1) + $1 + $1 + (-$1) + (-$1) + (-$1) + (-$1)) * 100
IMI = ($2 / $2 + (-$4)) * 100
IMI = ($2 / -$2) * 100
IMI = -100
The resulting Intraday Momentum Index for this 10-day period is -100, indicating a strong downward trend.
By analyzing the Intraday Momentum Index over different time periods, traders and investors can gain insights into the strength and direction of price trends, and potentially identify opportunities for profitable trades.

Emily Bibb simplifies finance through bestselling books and articles, bridging complex concepts for everyday understanding. Engaging audiences via social media, she shares insights for financial success. Active in seminars and philanthropy, Bibb aims to create a more financially informed society, driven by her passion for empowering others.