
What is a Bullish Harami?
A Bullish Harami is a candlestick pattern that indicates a potential reversal in a downtrend. It is formed by two candles, where the first candle is a large bearish candle and the second candle is a smaller bullish candle that is completely engulfed by the body of the first candle.
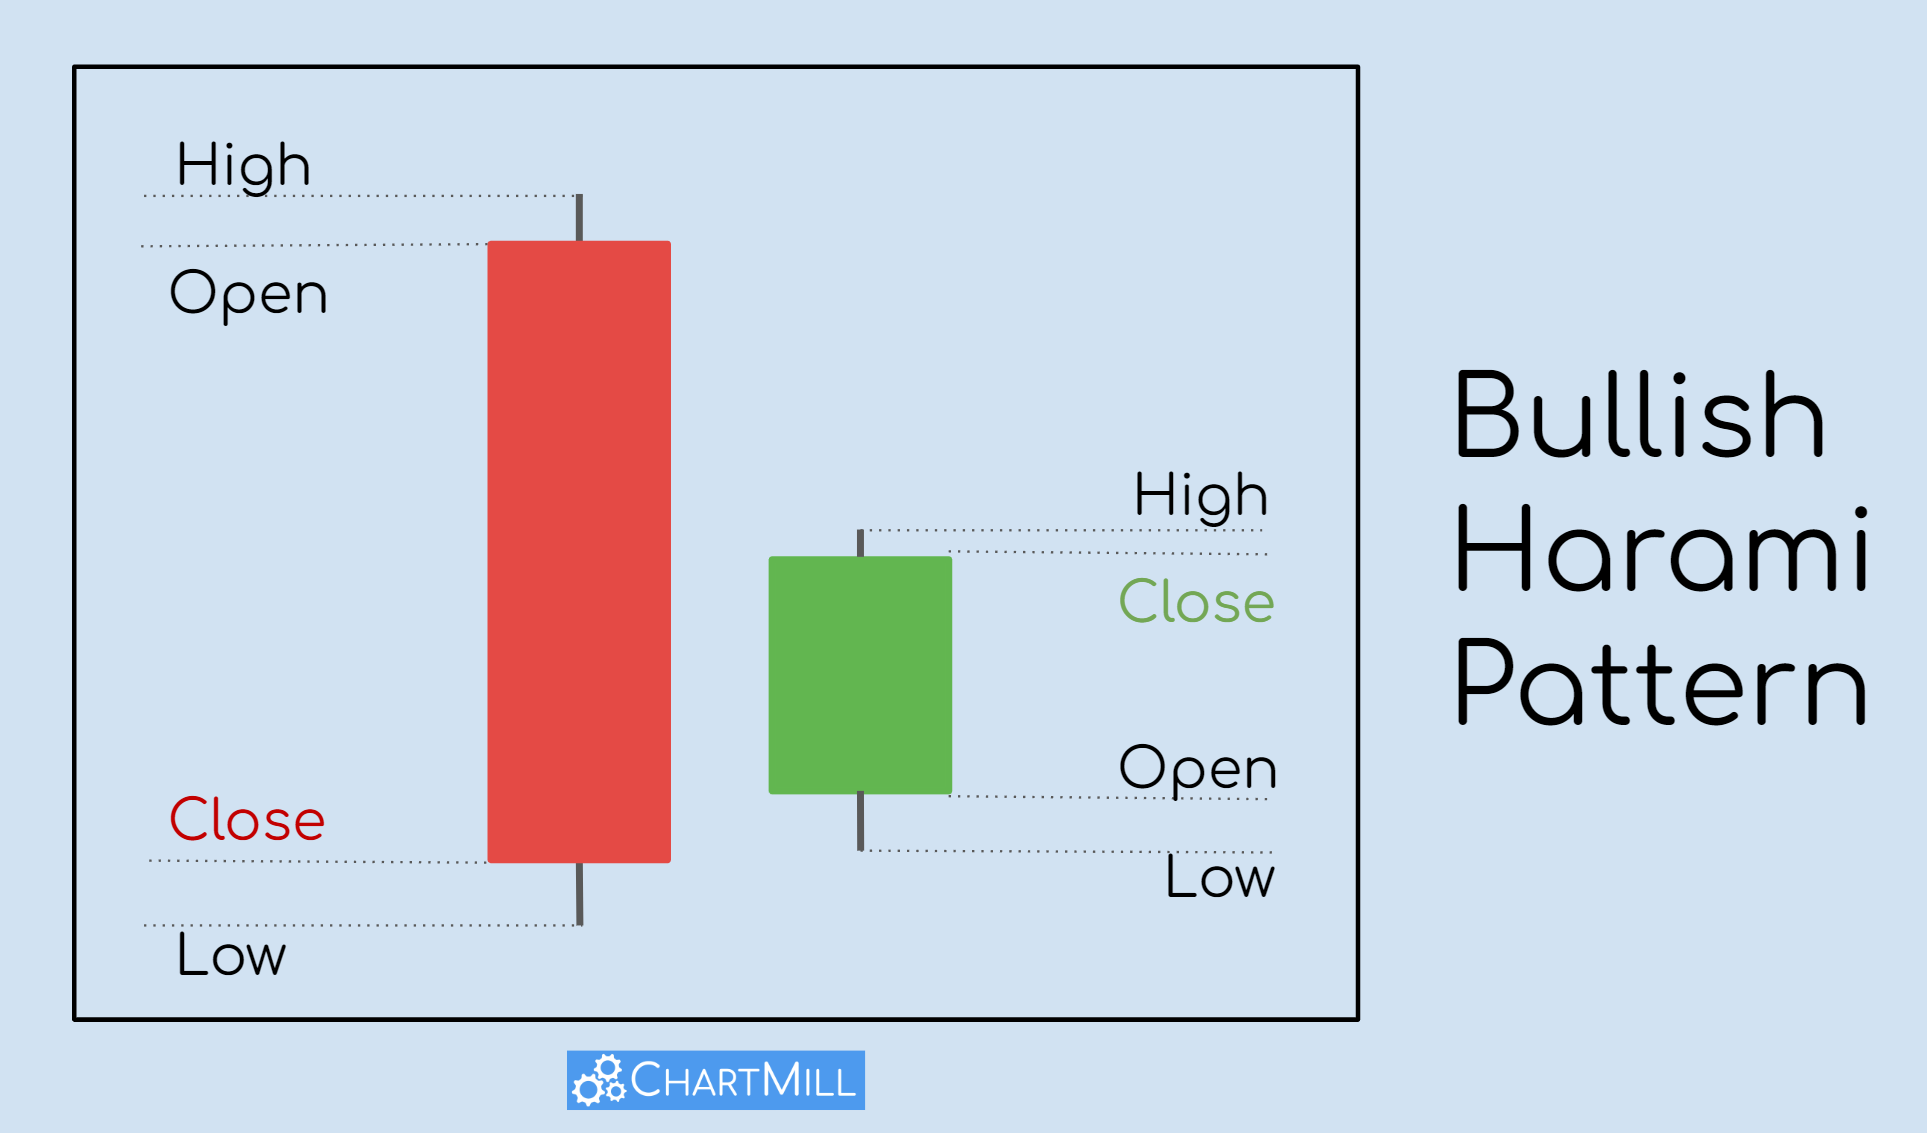
To identify a Bullish Harami, look for the following characteristics:
- The first candle should be a large bearish candle, indicating a strong downtrend.
- The second candle should be a smaller bullish candle, completely engulfed by the body of the first candle.
- The second candle should have a lower low and a higher high compared to the first candle.
- The Bullish Harami pattern is more reliable when it occurs after a prolonged downtrend.
Traders often use the Bullish Harami pattern as a signal to enter long positions or to close out short positions. However, it is important to wait for confirmation from other technical indicators or price action before making any trading decisions.
It is also worth noting that the Bullish Harami pattern is just one of many candlestick patterns used in technical analysis. Other common patterns include the Doji, Hammer, and Engulfing patterns, each with its own unique characteristics and interpretations.
Identifying Other Trading Patterns
While the Bullish Harami pattern is a powerful signal for a potential trend reversal, it is important for traders to be aware of other trading patterns that can provide additional confirmation or alternative trading opportunities. Here are some common trading patterns that traders can look for:
1. Bullish Engulfing Pattern
The Bullish Engulfing pattern is another reversal pattern that can indicate a potential bullish trend. It occurs when a small bearish candlestick is followed by a larger bullish candlestick that completely engulfs the previous candlestick. This pattern suggests that buyers have overwhelmed sellers and that the bullish momentum is likely to continue.
2. Morning Star Pattern
The Morning Star pattern is a three-candlestick pattern that can signal a potential trend reversal from bearish to bullish. It consists of a large bearish candlestick, followed by a small candlestick with a lower body, and finally a large bullish candlestick. This pattern indicates that sellers are losing control and that buyers are starting to take over.
3. Hammer Pattern
The Hammer pattern is a single candlestick pattern that can indicate a potential trend reversal. It has a small body and a long lower shadow, resembling a hammer. This pattern suggests that buyers have stepped in to push prices higher after a period of selling pressure.
4. Bullish Doji Star
The Bullish Doji Star is a two-candlestick pattern that can indicate a potential trend reversal. It consists of a bearish candlestick followed by a Doji candlestick, which has a small body and represents indecision in the market. Finally, a bullish candlestick confirms the reversal. This pattern suggests that buyers are gaining control after a period of selling pressure.
| Pattern | Description |
|---|---|
| Bullish Engulfing Pattern | A reversal pattern where a large bullish candlestick engulfs a small bearish candlestick. |
| Morning Star Pattern | A three-candlestick pattern that signals a potential reversal from bearish to bullish. |
| Hammer Pattern | A single candlestick pattern with a small body and a long lower shadow. |
| Bullish Doji Star | A two-candlestick pattern that indicates a potential trend reversal. |

Emily Bibb simplifies finance through bestselling books and articles, bridging complex concepts for everyday understanding. Engaging audiences via social media, she shares insights for financial success. Active in seminars and philanthropy, Bibb aims to create a more financially informed society, driven by her passion for empowering others.