
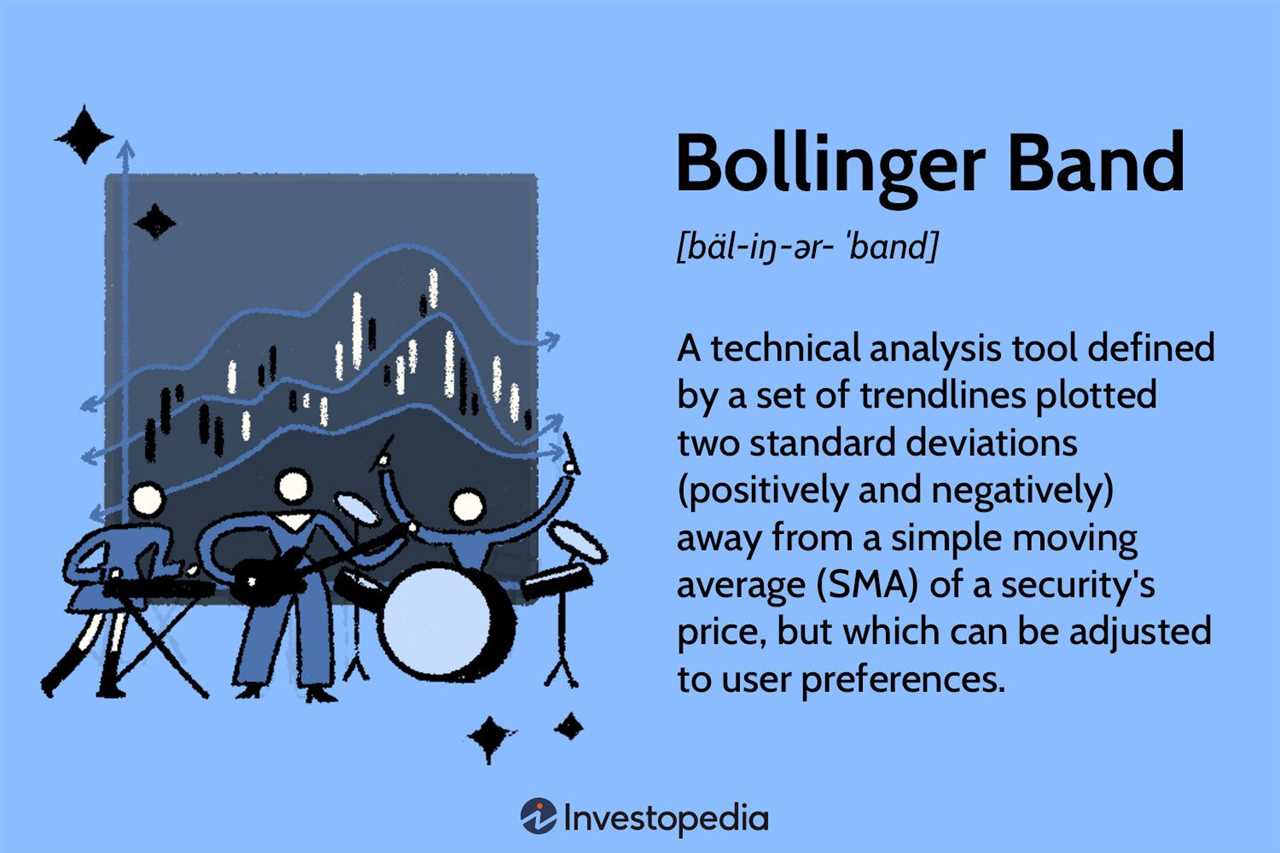
Bollinger Bands® Explained: A Guide for Investors
Bollinger Bands® are a popular technical analysis tool used by investors to analyze and predict price movements in financial markets. Developed by John Bollinger in the 1980s, Bollinger Bands® consist of a simple moving average (SMA) line and two standard deviation lines plotted above and below the SMA line.
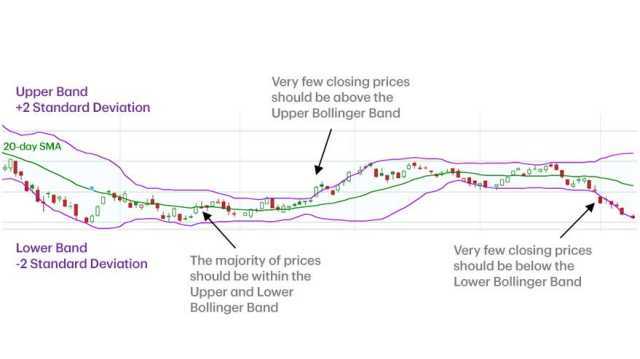
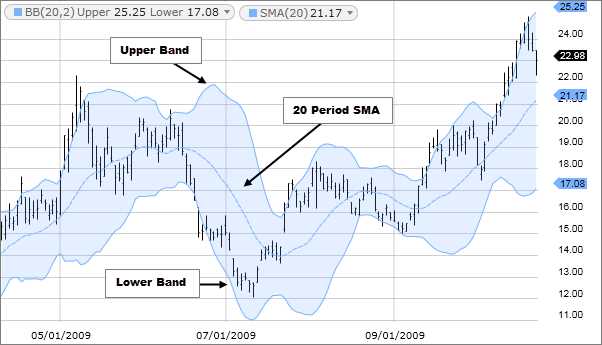
The SMA line represents the average price over a specific period of time, typically 20 days. The upper and lower standard deviation lines are calculated based on the volatility of the price. When the price moves towards the upper band, it indicates that the market is overbought, and when it moves towards the lower band, it indicates that the market is oversold.
However, it is important to note that Bollinger Bands® should not be used in isolation. They are most effective when used in conjunction with other technical analysis tools and indicators. For example, traders may use Bollinger Bands® in combination with trend lines or moving averages to confirm signals and make more informed trading decisions.
In addition to identifying overbought and oversold conditions, Bollinger Bands® can also be used to measure volatility. When the bands are close together, it indicates low volatility, and when they are wide apart, it indicates high volatility. This information can be useful for determining the appropriate position size and setting stop-loss orders.
Bollinger Bands® are a popular technical analysis tool used by investors to analyze price volatility and identify potential trading opportunities. Developed by John Bollinger in the 1980s, Bollinger Bands® consist of a simple moving average (SMA) and two standard deviation bands.
How Bollinger Bands® Work
The SMA is the middle line of the Bollinger Bands® and represents the average price over a specified period. The upper band is calculated by adding two standard deviations to the SMA, while the lower band is calculated by subtracting two standard deviations from the SMA. The standard deviation is a measure of price volatility.
When the price is trading within the Bollinger Bands®, it is considered to be in a normal range. However, when the price moves outside the bands, it is seen as a potential signal of an upcoming trend reversal or a significant price move.
Using Bollinger Bands® for Trading

Traders use Bollinger Bands® in various ways to make trading decisions. One common strategy is to look for price breakouts above or below the bands. A breakout above the upper band may indicate an upward trend, while a breakout below the lower band may suggest a downward trend.
Another approach is to look for price reversals when the price touches or crosses the bands. For example, if the price touches the upper band and then starts to move lower, it could be a signal of a potential trend reversal to the downside.
Limitations of Bollinger Bands®
While Bollinger Bands® can be a useful tool for technical analysis, they have their limitations. One limitation is that they are based on historical price data and may not always accurately predict future price movements.
Additionally, Bollinger Bands® should not be used as a standalone indicator but should be used in conjunction with other technical analysis tools and indicators for better accuracy. It is also important to consider other factors, such as market conditions and news events, when interpreting Bollinger Bands® signals.

Emily Bibb simplifies finance through bestselling books and articles, bridging complex concepts for everyday understanding. Engaging audiences via social media, she shares insights for financial success. Active in seminars and philanthropy, Bibb aims to create a more financially informed society, driven by her passion for empowering others.