What Is a Wedge Pattern?

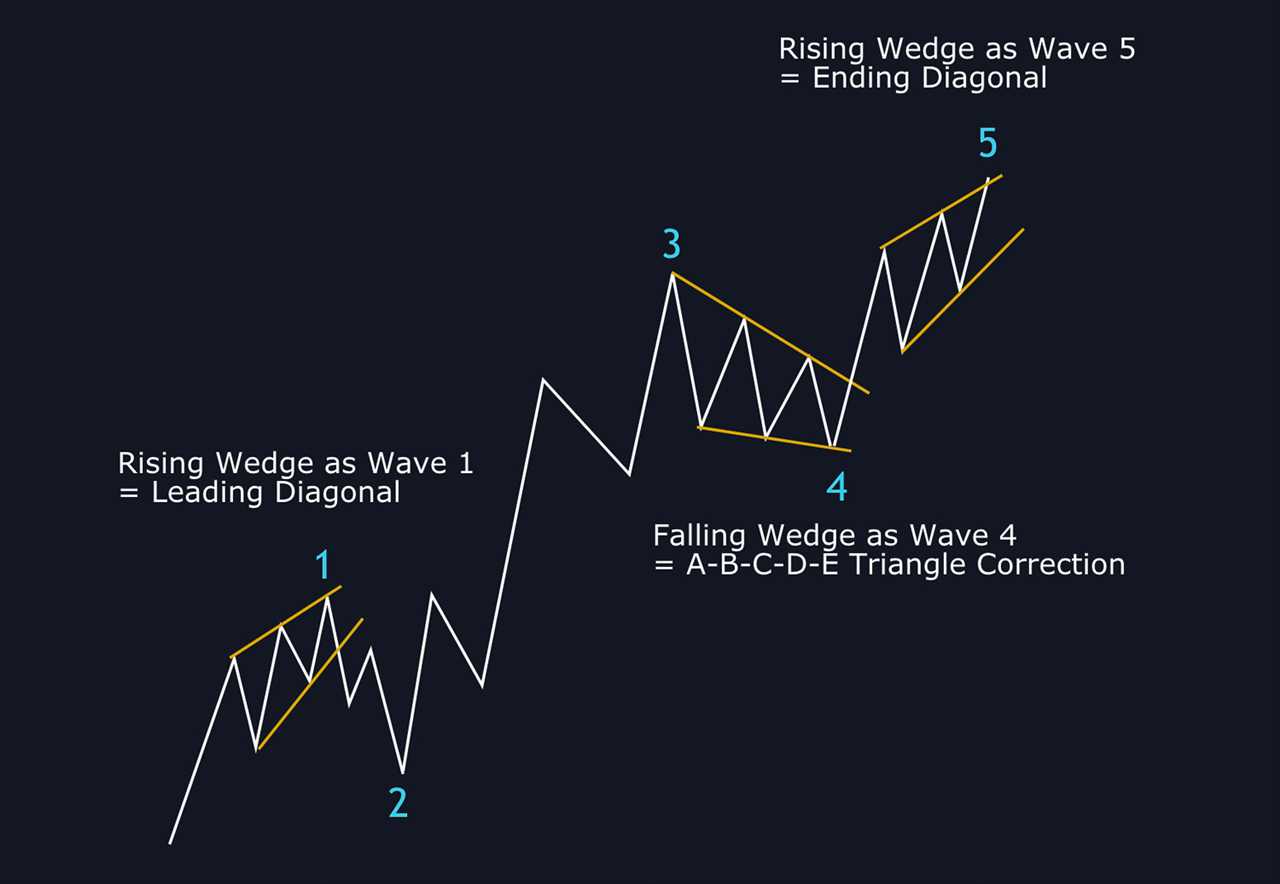
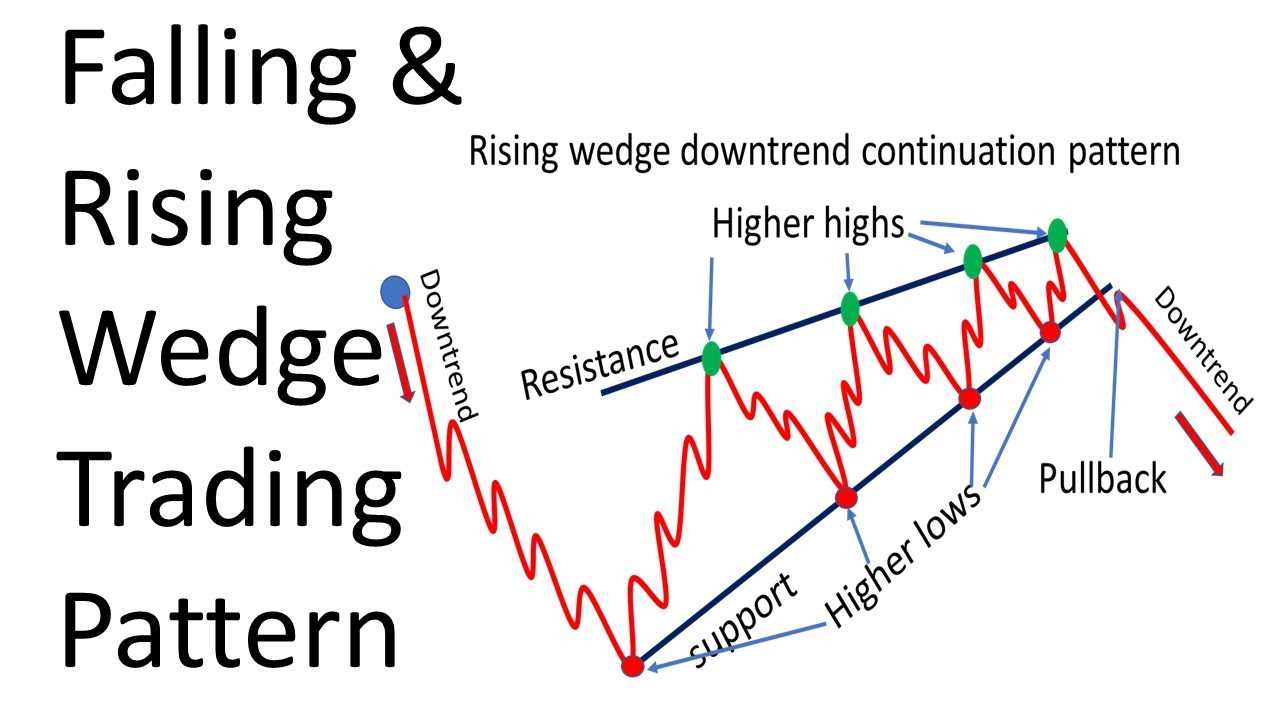
A wedge pattern is a technical analysis pattern that is formed when the price of an asset consolidates between two converging trendlines. The trendlines can be either ascending (rising wedge) or descending (falling wedge).
Traders and investors use the wedge pattern to identify potential trading opportunities. When the price breaks out of the pattern, it can be a signal to enter a trade in the direction of the breakout. For example, if the price breaks out of a rising wedge pattern to the upside, it may be a signal to buy the asset. Conversely, if the price breaks out of a falling wedge pattern to the downside, it may be a signal to sell the asset.
It is important to note that the wedge pattern is not always a reliable indicator of future price movements. Sometimes, the price may break out of the pattern in the opposite direction of the previous trend, resulting in a false breakout. Therefore, it is crucial to use additional technical analysis tools and indicators to confirm the validity of the pattern.
Exploring Falling and Rising Wedge Patterns

In technical analysis, falling and rising wedge patterns are two common chart patterns that can provide valuable insights into the future direction of a financial instrument’s price. These patterns are formed when the price of an asset consolidates between two converging trendlines, creating a narrowing price range.

Emily Bibb simplifies finance through bestselling books and articles, bridging complex concepts for everyday understanding. Engaging audiences via social media, she shares insights for financial success. Active in seminars and philanthropy, Bibb aims to create a more financially informed society, driven by her passion for empowering others.
