
Breadth Indicator Overview
A breadth indicator is a technical analysis tool that measures the overall strength or weakness of a market or index by analyzing the number of advancing and declining stocks. It provides traders and investors with valuable insights into the breadth of market participation and can help identify potential trend reversals or confirm the strength of an existing trend.
The AD Line, for example, calculates the difference between the number of advancing stocks and declining stocks on a given trading day. A positive AD Line suggests that more stocks are advancing than declining, indicating overall market strength. Conversely, a negative AD Line indicates more declining stocks, signaling market weakness.
While breadth indicators can be powerful tools for market analysis, it is important to understand their limitations. They are based on historical data and may not always accurately predict future market movements. Additionally, breadth indicators are most effective when used in conjunction with other technical analysis tools and indicators to confirm signals and reduce false positives.
Overall, breadth indicators provide traders and investors with a broader perspective on market trends and can help inform their trading decisions. By analyzing the participation of stocks in market movements, breadth indicators can offer valuable insights into the overall health and direction of the market.
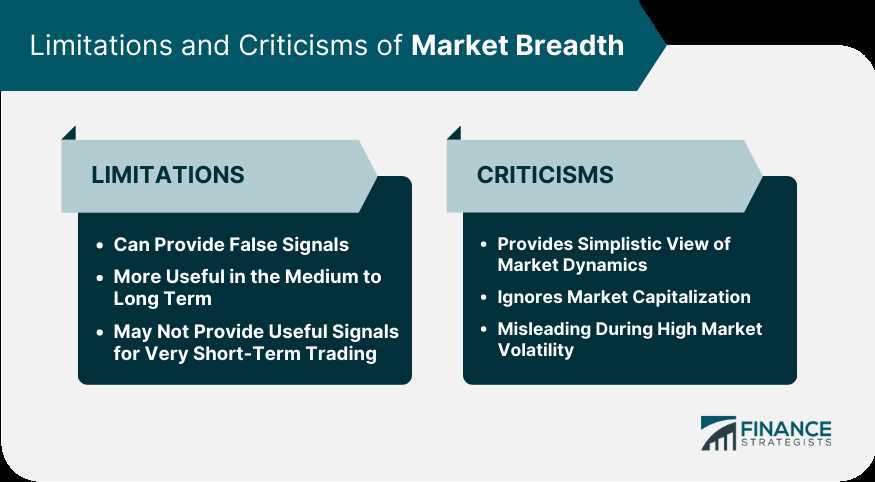
Examples and Limitations
One limitation of breadth indicators is that they are based on historical data and may not always accurately predict future market movements. Market conditions can change rapidly, and breadth indicators may not always reflect these changes in a timely manner. Additionally, breadth indicators are just one tool among many in technical analysis, and should be used in conjunction with other indicators and analysis techniques for a comprehensive view of the market.
Overall, breadth indicators can be valuable tools in technical analysis, providing insight into market strength and weakness. However, it is important to understand their limitations and use them in conjunction with other indicators for a well-rounded analysis.

Emily Bibb simplifies finance through bestselling books and articles, bridging complex concepts for everyday understanding. Engaging audiences via social media, she shares insights for financial success. Active in seminars and philanthropy, Bibb aims to create a more financially informed society, driven by her passion for empowering others.